Excel Spreadsheets
For many years, I have used Excel and XLQ to run daily screens for trade candidates. At one point, I was working with the Excel API from IB to submit and monitor trades directly from Excel. This probably still the way that comes closest to using what I know to automate my trades, however the spreadsheet connection was not stable, so I’m back to looking at other options.
Because spreadsheets are how I continue to review the market and search for trades, I updated a spreadsheet to assist me with my day trades. Today I made an attempt to use the spreadsheet to manually enter trades. By doing so, I made a few discoveries about the sheet and my trading style. I quickly used a filter to limit what was showing on the spreadsheet to only those targets with a history of high reward to risk ratios. The part I missed was the need to monitor the distance to my stop loss. There were a few candidates on the list that had very small movements as units of risk. For example, GDX used a stop loss of only 8 cents. I realized this after I placed my order to buy. That makes each penny change in price .125R. I chose to then limit my targets to those with a stop of 20 cents or more.
By the end of the day, it always shows me a nice potential profit, so I’ll continue to work with it until I can get the execution in place.
Swing Trades
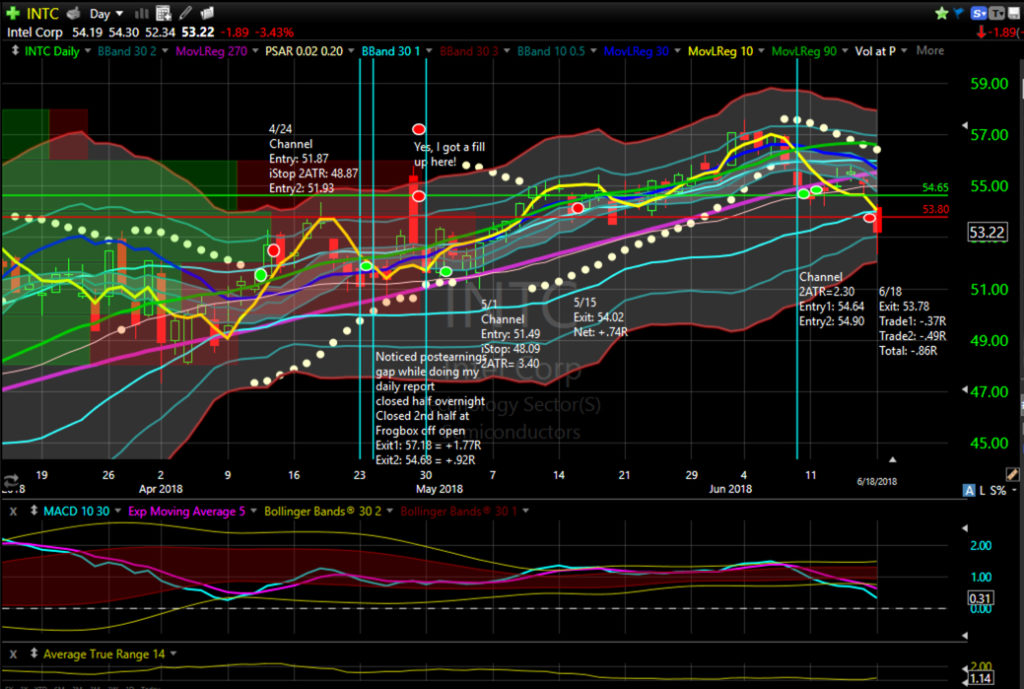
Five trades were opened today while the double position in INTC was stopped out.

Long: AWK, CAT(2), CVX, FCX, GIS, JPM, MKC, OKTA, RIO, TLT, VPL, XME.
Short: XES.