Swing Trades
Following my observations yesterday about not framing trades for the short side, I framed 6 trades for possible entry and most of them were for possible short entries. The three that were willed were all shorts: EWW, AA, and IPG. WYNN opened below the stop, so both positions were closed out, netting +.32R total for the two trades.

There are now 21 open trades showing +5.07R:
Long: AXP, CRM, CSCO(2), DWDP, GILD, JPM, KR, MSFT, RIO, SLB(2), TWTR, XES(2), XLE(2), XME.
Short: AA, EWW, IPG.
Reflections
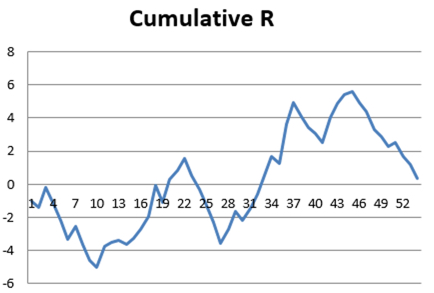
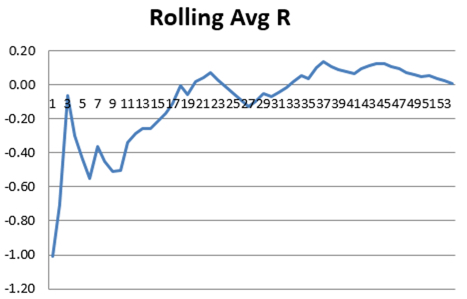
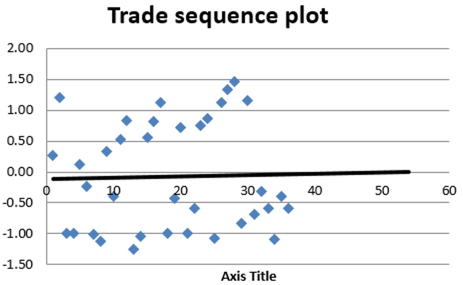
The month of May provided 54 trades which netted a paltry +.35R. Graphs of the trade results are included below.
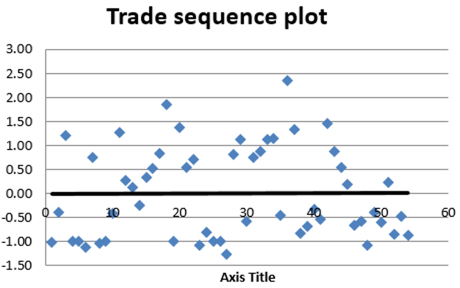

The largest win was +2.34R. There were six trades generating losses greater than 1R. Three of those six were just a penny or two away, so can be ascribed to slippage on stop order fills. Two were opening gaps below the stop. Only one of the six can be ascribed to improper stop placement. I had two positions on in one stock and the second fill was higher than the first, but the stop was left at the price based on the first entry.
The month started in a sideways normal condition and moved more bullish, but also became more quiet. Thirty-six of the trades were channel trades. All six of the losses greater than 1R were channel trades. Clearly this is the easiest system for me digest for entry points. Many of the positions moved in my favor after entry, but the back and forth sideways and drop in volatility led me to close out many of these positions as losses, even when they had been winners at different times. Here’s the plot sequence for just the channel trades in May:
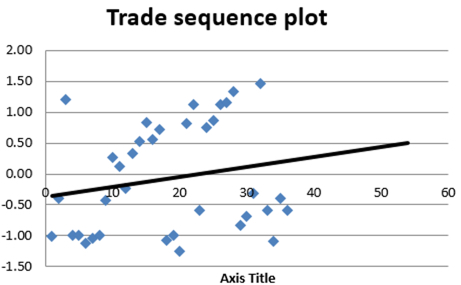
The above is based upon date closed. Here’s the same chart based on date opened:
While I was starting to feel like I might have been improving as the month progressed, when you see the graph by open date, that improvement is minimal. It should also be noted that these are all trades closed in May. Some were opened in April and held into May. Any positions opened in May but not yet closed, are not reflected in either of these graphs.
I believe all these trades were placed with the 2ATR initial position sizing stop loss. For my next step, I’d like to analyze the maximum negative excursion for each position in terms of ATR to determine if there is some earlier point when I can cut the losses to either keep them from running to -1R and/or change my position sizing so that with a tighter stop loss, my gains are multiples of my losses.
General conclusion for today: there is always more to consider about the log of trade results, and your viewpoint can influence the conclusions you might be tempted to draw.